Pagespeed & Core Web Vitals Test
- ✔ Performance scores
- ✔ Core Web Vitals
- ✔ Chrome User Experience Reports
The fastest Pagespeed & Web Vitals Checker
CrUX reports, bulk pagespeed tests and CrUX histories
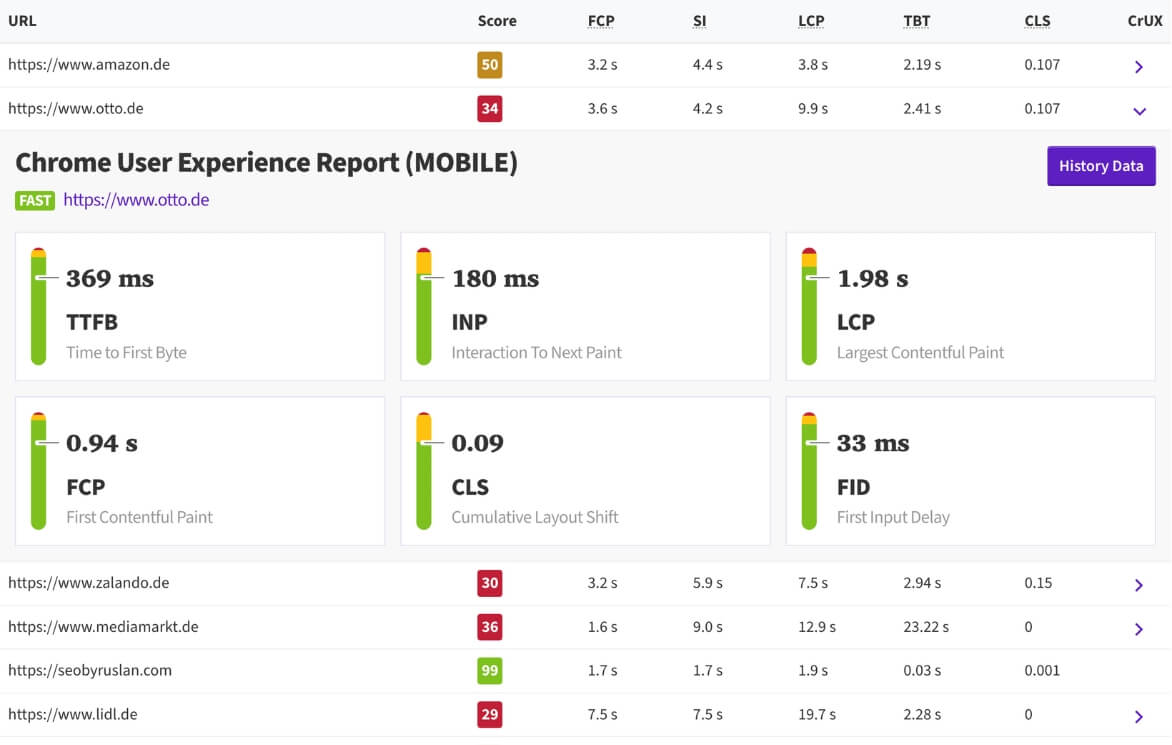
You can use the tool to test website speed and core web vitals for up to 50 URLs simultaneously.
Get detailed and performant reports that are 80% faster than the competition. Analyze your website and those of your competitors with CrUX integration for realistic insights.

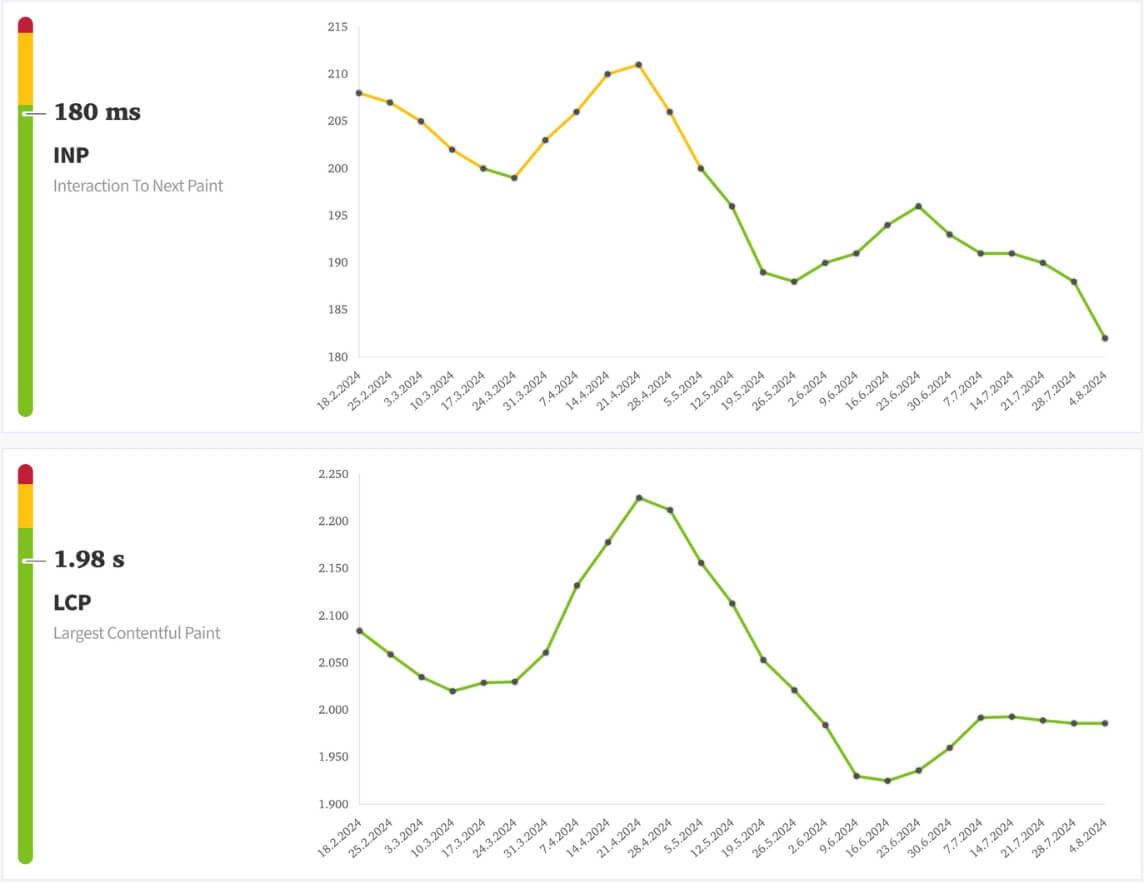
CrUX History of the last 6 months
Has the CLS value been this shitty all this time? At least you can see if it has been in the last 6 months. If a CrUX report is available (enough Chrome user data must have been collected), I will show you the last months.

What values are measured?
Performance Score
This is the Lighthouse Performance Score, which ranges from 0 to 100. It is a calculation of the other metrics.
LCP (Largest Contentful Paint)
The Largest Contenful Paint indicates how long it took for the largest visible element to be fully loaded.
FCP (First Contentful Paint)
The First Contentful Paint measures how long it takes for the browser to render the first content element on the page. This metric provides an insight into the initial loading time of the page.
SI (Speed Index)
The speed index shows how quickly the visible page content is fully loaded. The lower the value, the faster the user will be able to see the page content.
TTI (Time to Interactive)
The Time to Interactive measures how long it takes until the page is fully interactive - in other words, until the user can interact with the page without experiencing any delays. A low TTI value is important for a smooth user experience.
TBT (Total Blocking Time)
The total blocking time measures how long user interactions (e.g. clicks) are blocked by long task executions. The lower this value, the smoother the user experience.
CLS (Cumulative Layout Shift)
The Cumulative Layout Shift measures how much the visible page content moves unexpectedly while the page is loading. A low value means that the page loads stably and the user is not irritated by sudden layout shifts.
CrUX (Chrome User Experience Report)
If your site has enough Chrome user data, the field data will also be displayed in the details.
Feedback, suggestions, insults? Bring it on!
This should not be a one-way street. In order to constantly improve the tools, I would like to receive constructive feedback. As a thank you there is also a dofollow link.
But: This does not mean that you should place backlinks for your dog salon customers here. Write something with added value and the comment will be activated.
Post a comment
Frequently asked questions about the Bulk Web Vitals / CrUX Checker
Here you will find answers to frequently asked questions about my tool:
What can the Bulk Web Vitals / CrUX Checker do?
How many URLs can I check at the same time?
What values are measured?
- Performance Score (Lighthouse Performance Score from 0 to 100)
- LCP (Largest Contentful Paint)
- FCP (First Contentful Paint)
- SI (Speed Index)
- TTI (Time to Interactive)
- TBT (Total Blocking Time)
- CLS (Cumulative Layout Shift)
- CrUX (Chrome User Experience Report), if available
Hi,
The desktop data appears to be incorrect: The graphs do not match the values next to them. But otherwise very practical.
Greetings,
Mark
Fact, was a wrong parameter. Should work now, thanks!